Every season is different
We have been monitoring pollen at the same site in Cape Town for 20 years.
Every season is different and forecasting models are imperfect.
For instance, this graph shows how over the course of four consecutive years the seasons for grass pollen looked quite different:
- 2011 had two significant peaks
- 2012 was short and very intense
- 2013 and 2014 were mild
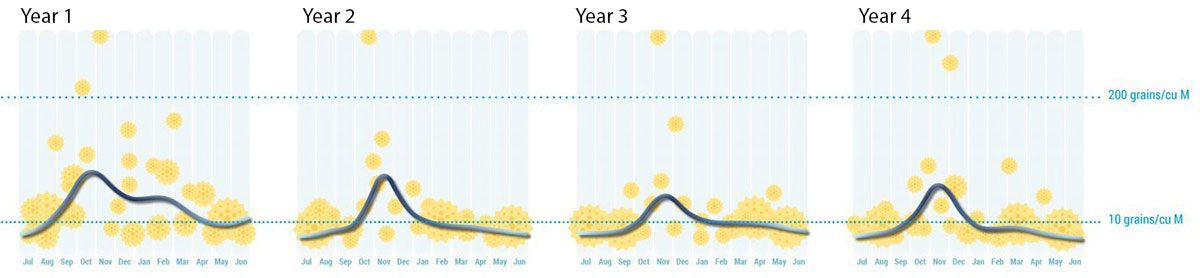
Seasonal Variations
Seasonal Variations: Coastal Grass Pollens (1 July – 30 June)
Short and medium-term weather patterns are the major influences on this variability.
Example
The recent drought in Cape Town was followed by increased rains during winter 2018 and in Cape Town there was a four-fold increase in the amount of grass pollen that was measured during spring.
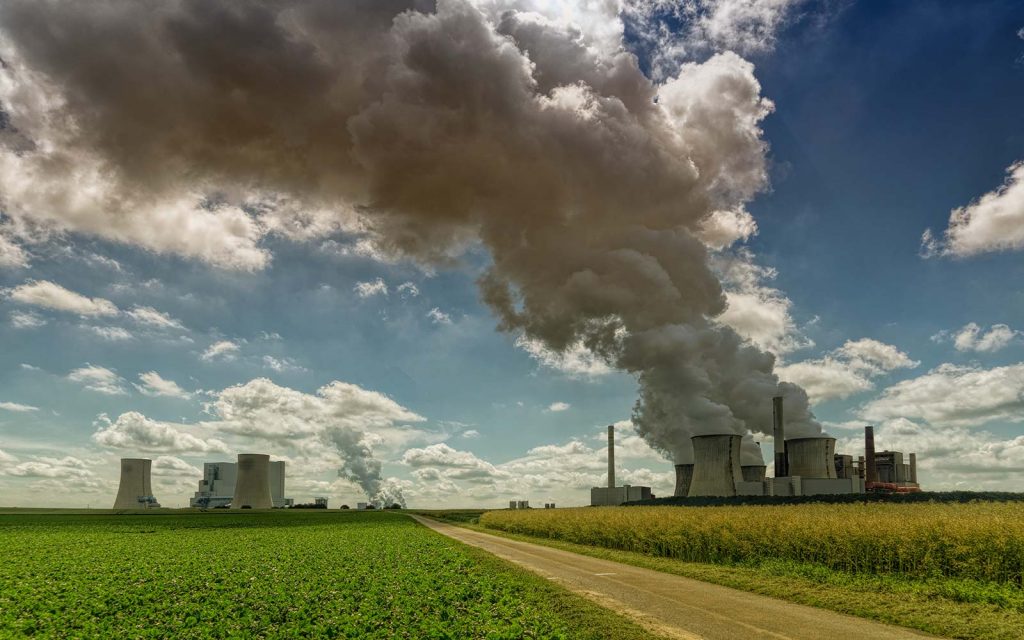
Climate change and pollen
Climate Change occurs in response to greenhouse gasses which include carbon dioxide, or CO2, in the air. The result has been a steady increase in global temperatures.
An important effect of climate change on human health will be the effects of warmer temperatures and increased CO2 on allergens and allergic diseases, such as asthma and allergic rhinosinusitis.
Climate change will have a profound impact on pollen in the following ways:
Increased CO2 concentrations are linked to increasing plant size, and pollen production for a variety of pollen species from Texas to Canada. This is likely to be similar in South Africa.
Example: Ragweed pollen
Each pollen grain of ragweed has been shown to contain greater concentration of Amb a1, the major ragweed allergen.
Example: Ragweed pollen
Ragweed, a native weed of North America, has been invading large areas of South America and Europe for the last few decades. It will likely arrive in South Africa soon.
Modelling suggests airborne ragweed pollen concentrations will be 4× higher in 2050. The impact in Europe will be that allergic sensitisation to ragweed will more than double from 33 to 77 million people.
Ragweed pollen seasons have been increasing in response to rising temperatures by as much as 13-27 days for latitudes above ~40°N since 1995.
Changes in climate are already altering the flowering patterns of many plants. Rose growers in Gauteng, the Midlands and the Cape have noticed that shifting weather patterns have forced them to change their recommended pruning months due to a delay in months of frost.
Birch and oak trees appear to be flowering up to two weeks earlier than 20 years ago.
Alert: Beware false counts
Many weather sites post pollen counts for cities in South Africa and sometimes even for smaller areas like the suburbs of cities. These are all imagined counts and are not only inaccurate, but they are misleading.
Example
Some weather sites report on Ragweed. Ragweed has not yet been seen from pollen sampled from the air of any of the cities in South Africa!
This is the first time in SA that these sites have been simultaneously monitored.
Forecasting pollen would be useful, but there are NO shortcuts for pollen predictions.
Pollen predictions must be based on years of sampling from the same sampling site and the formula used must include pollen counts from the previous year and the current year as well as weather measurements. This is one of the long-term goals of our National pollen monitoring initiative.
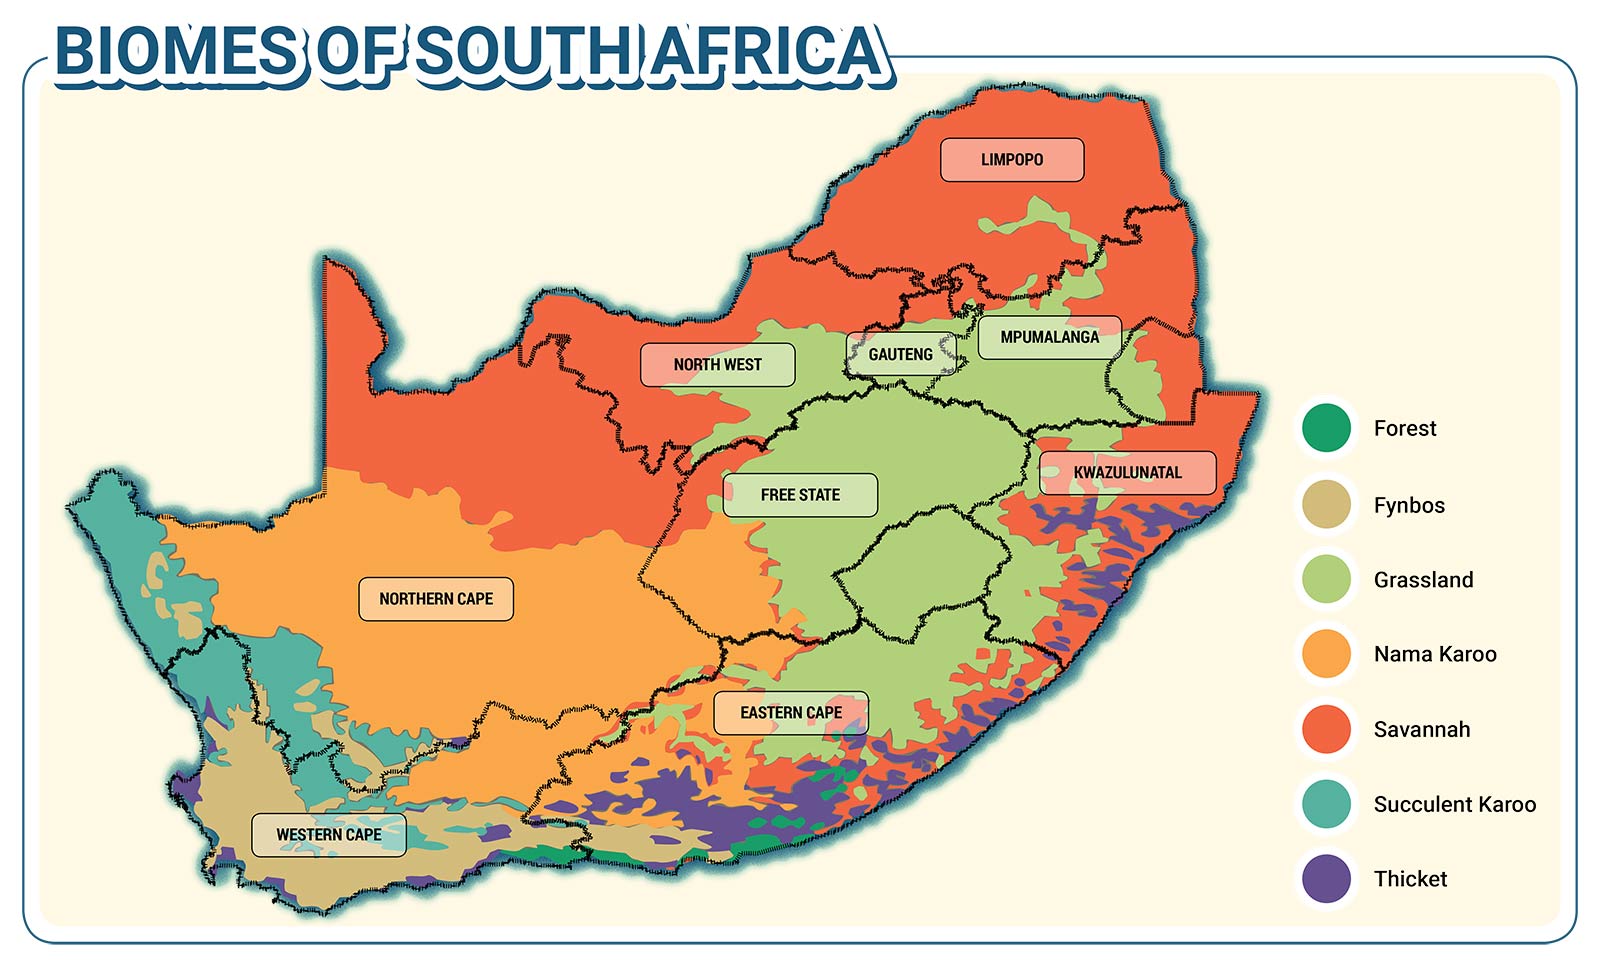
Which areas in SA have the lowest pollen counts?
We don’t know; which is why we want to monitor.
Pollen in the atmosphere has not been measured in many South African cities.
Pollen counts have only been measured in Cape Town in recent years.
Pollen concentrations in the air have been measured in other cities but these studies were carried out decades ago and in many South African cities the pollen content of the air has never been examined.
In most areas and cities, we do not know what the main pollen triggers are or at which time of the year they occur.